3.2.2 CGS - Connectivity of Green Spaces
Last modified by Emily West on 2022/02/08 09:43
3.2.2 CGS - Connectivity of Green Spaces
| Topic | Urban challenges | Sub-challenges |
|---|---|---|
| Environment | 3 - Biodiversity and Urban Spaces | 3.2 - Urban Space Development and Regeneration |
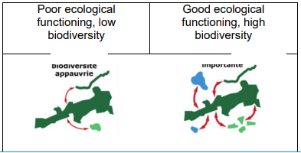
Description | This indicator enables to assess natural habitats best connected to each other on the study area. It takes into account the fragmentation of the habitat. Thus, this indicator will help to know where to focus efforts, where to improve the connectivity (where it is the lowest) and where to maintain green spaces in priority (where connectivity is the highest because these areas are more favourable to species) → decision-making tool. The efforts to be made will depend on the objectives of each city.
|
Scale as linked to D2.2 framework |
|
Data source [ link to data framework] |
|
Data Needs |
|
Expected Outputs |
|
Calculation methods |
|
Links and references |
|